Understanding the fractal nature of price movement is an important concept to help you analyse the markets and optimise your entry and exist.
So what is a fractal? A fractal is a natural phenomenon, a mathematical set or a geometrical pattern that exhibits a repeating pattern that displays at every scale.
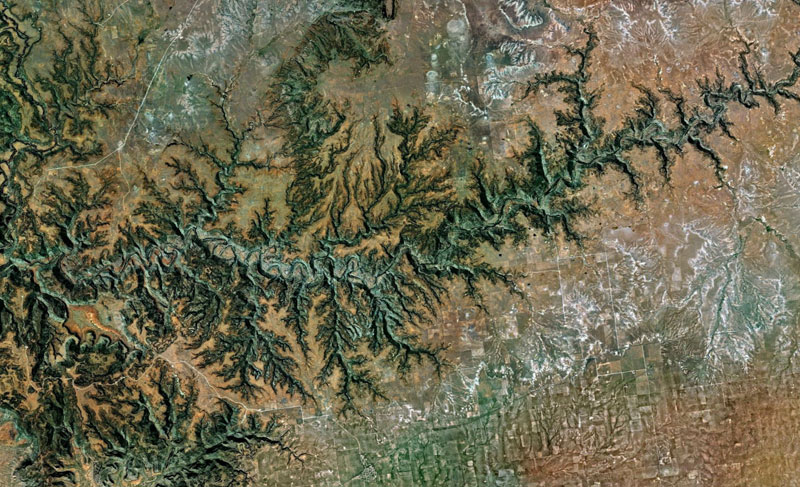
The key words are ‘repeating’ and ‘every scale’. A simplified example could be of an onion – you peel one layer, another presents itself which is similar but scaled down version of previous layer, and so on until you reach the kernel, which also is layered at a scale that we don’t bother peeling. You get the idea. A geometric example would be triangle within a triangle, within a triangle, and so on. Here are some examples of fractal patterns:


Now coming to analysing financial markets for trading activity, when you look at price charts in different time frames you will notice that they follow ‘Fractal’ formations. Price charts in different timeframe and across markets look the same, except that the corresponding range (and hence the risk or reward) associated differs in scale. According to Benoit B. Mandelbort in his work, The (mis) behaviour of Markets, ‘In fractal analysis (of financial markets), a price series is like a long, folding car antenna. You can look at its full length, segment by segment; or you can simply collapse it so each length is stacked inside the next. Statistically speaking, the risks of a day are much like those of a week, month or a year. But the price variations scale with time.’
The famous Elliott Wave theory seems to be based on this fractal nature of price patterns.

Picture source: R.N. Elliott’s essay, “The Basis of the Wave Principle,” October 1940.
Why is an understanding of fractals important or even relevant for your trading? Well, once you understand the fractal nature, it is easier to analyse the charts, and ride the pattern at a scale you can afford. A trader can enhance his odds of being on the right side of a particular move (or wave); and size the position appropriately according to the scale of structure (higher the time scale, larger the range of structure and hence larger the risk and reward, therefore smaller the position size and vice-versa)
Hope this is useful for your trading. If you have any questions or would like to discuss this or any other trading subject, please send me an email on contact details provided on the website. Happy trading!
One reply on “Fractals in trading”
However, the most important thing to remember is that fractals are repainting!!! This means that once a fractal appears, let’s say, on top of a candle, and market goes and makes a new high within the period the fractal is set up, then the fractal will disappear and a new one will appear at the top of the next candle.