One of my long time colleagues and a mentor recently shared something very personal. He had invested in a property in London paying a staggering £650,000 for the one-bedroom flat. A similar sized property in Bristol (where I live) would be around £150,000. Why such a huge difference? Almost everyone would answer that with ‘it’s the location’.
Indeed location is the biggest if not the only factor. But what is going on at a deeper level? Why are people willing to pay so much higher for properties at these so called sought after locations. I asked my colleague the question – his response was, “well this is the going-rate, and it is likely to go up in future”.
It triggered a thought process in my mind as I reflected upon his comments and projected them into my trading activity. There are two key elements here – one, the ‘going rate’, a reflection of the ‘Demand and Supply’ situation; and two, an expectation that the prices will go up in future. These are the two reasons, why the prices are what they are.
Any trader who enters a trade does so thinking that the prices of the asset will go up after he has bought (or go down if he has shorted a particular market). There is no other reason to trade. The factor which causes the market to make big moves in any one direction is the imbalance between supply and demand resulting from the collective positions taken by traders holding opposite views about future value. Whilst the current price represents the collective decision of the market at any point in time, the price chart over time represents the foot print of the movements
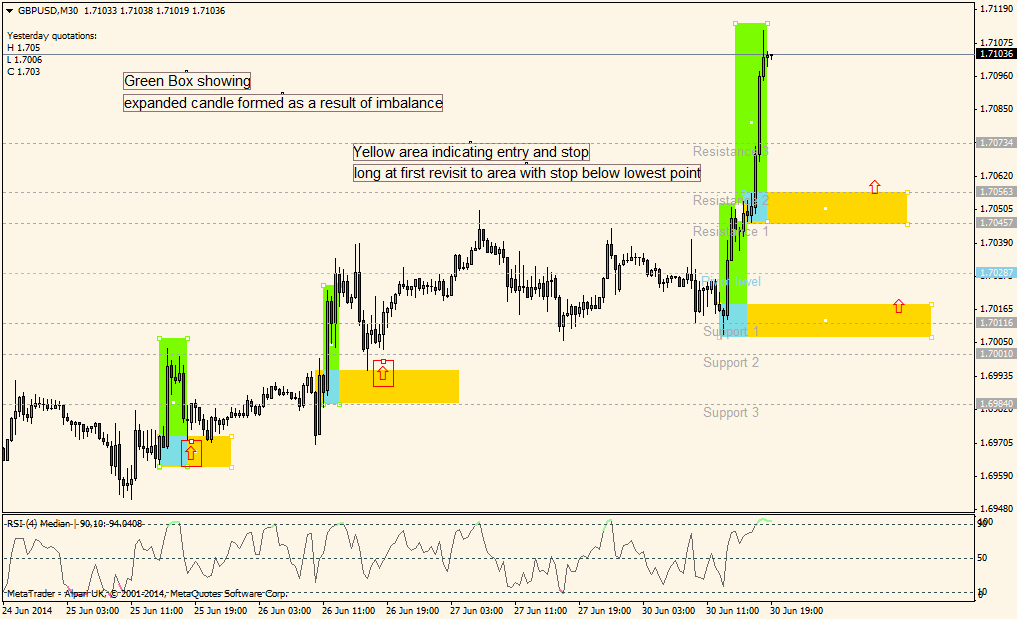
There are simple ways by which you can use the footprints and benefit from them. I use a simple strategy based on demand and supply imbalances for my own trading. An imbalance in demand & supply causes a sudden price movement indicated by expanded range candles/bars (relative to its recent predecessor candles). Once such an area/ level is established I look to get into trades at the first opportunity when price re-visits that area, in the direction of the initial thrust. It is a simple strategy that seems to work well in most timeframes (the higher timeframe, the better). Of course there are other factors that I take into account to ensure odds are in favour, but the decision is primarily based on these areas formed by demand/supply imbalance.
Take a look at the chart below for illustration – there are two successful trades marked, and two more areas marked for potential trades when price action revisits points of imbalance.
Hope this is useful for your trading. If you have any questions or would like to discuss this very important subject, please send me an email on contact details provided on the website. Happy trading!
Trading the financial markets (Stocks, Forex, Futures, Spreadbetting etc) has risks associated with it. Whilst it can be extremely rewarding, it can also result in losses, which if not managed properly can exceed your initial investments. Before embarking on trading, please ensure you understand the risks involved.