In the previous post I discussed the fractal nature of markets. In this article I would like to discuss another structural phenomenon which characterises price movement. This concept is called ‘Reversion to the Mean’.
Price for any asset class never moves in a straight line, it always forms waves of movements, thrusting forward, then retracing back before making another thrust and so on. This is applicable in cases of both upward and downward movement in prices.
‘Reversion to the Mean’ is a concept that suggests price always tends to go back to the mean (or average) after any extended move in any direction. Whether it happens as a form of sideways consolidation or a retracement, the tendency is for the price is to return to the mean representing a state of equilibrium between the opposing forces i.e. buyers and sellers.
The easiest way to observe this phenomenon is to plot moving averages using different periods. Take a look at this randomly picked chart – a 4 Hourly EUR-USD snapshot taken on after markets closed for the weekend on 19th Sep 2014.
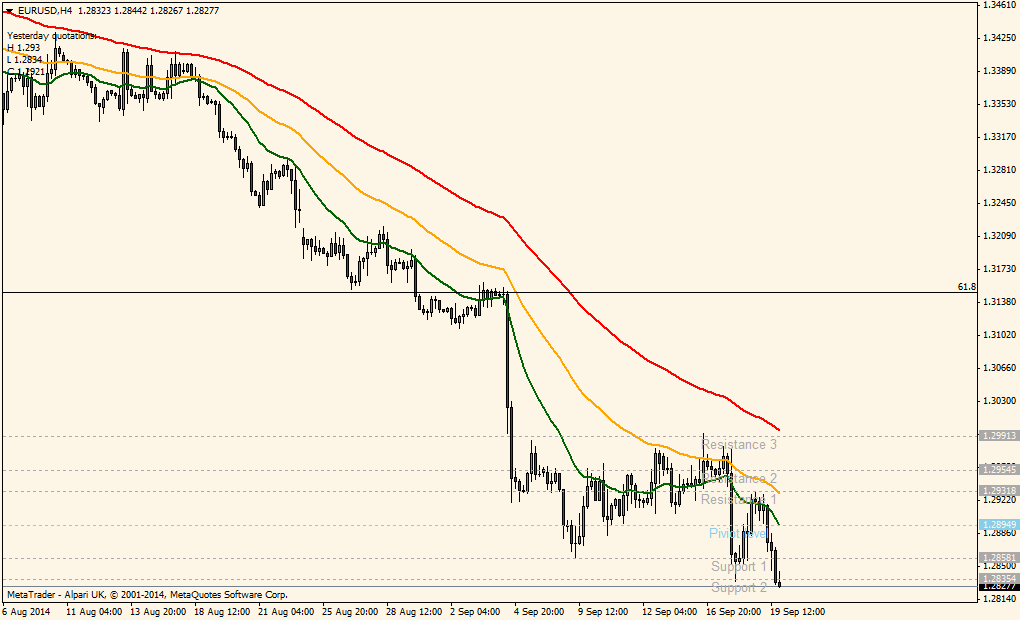
For illustration of the point we have plotted three simple moving averages (SMA) on the chart for 20 period, 50 period and 100 period represented by green, amber and red line graphs respectively.
On this chart, the price is in a clear downward trend but you will notice that after each move down it retraces back towards those SMA lines representing mean for different periods. The smaller the period average, the more chances of the price touching or breaching it. The larger the period average, the less chance of touching and breaching it, but movement away from it is far extended. A lot of trend and swing strategies are based on this characteristic of price movement. Even the famous Elliot wave theory is based on reversion to the mean. The concept of waves within waves is nothing but a continuous tendency of price to come back to the mean in different timescales.
Here is another chart – a 4-horly USD-CAD snapshot taken after market closed for the weekend on the 19th Sep 2014. This isn’t in a clear upward or downward trend.

Even though the price isn’t trending, the tendency for the price to retrace back to average is quite apparent. In the case of sideways movement, as is the case in this chart, the price tends to breach the averages to swing to the other side more often than in a trending market condition, but every time there is an extension away from the mean, it does tend to revert to it, representing equilibrium among buyers and sellers.
Hope this is useful for your trading. If you have any questions or would like to discuss this or any other trading subject, please send me an email at Knowledge Candles via the contact details provided on the website.
Happy trading!